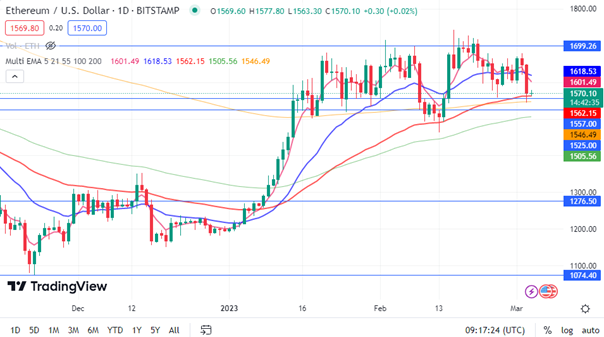
Accompanying the hard sell in Bitcoin with the news flow yesterday, Ethereum started the day more calmly. Unable to close above the $1700 resistance, Ethereum broke the averages of EMA5 and EMA21 with yesterday’s selling and fell to the level of EMA200. It closed on the EMA55 with subsequent purchases. Although this situation is followed with concern among investors, EMA200 is essential for a more significant period. Although the strength of Ethereum, which is currently trying to hold on to EMA55, has weakened, the supports are working well. Ethereum, which started trading at $ 1648 yesterday, closed at $ 1569 with a decrease of 4.75% after seeing the lowest level of $ 1543.
Ethereum, which started at the $ 1569 level, is trading at $ 1570 with an increase of 0.02% at the time of writing.

Ethereum Chart Analysis
Ethereum, which could not close above the $ 1700 level and turned its direction down, broke down the EMA5 and EMA21 levels with a hard sell yesterday. Ethereum, which went down to the EMA200 support in a single candle, has picked up a little with the end-of-the-day purchases. When the graph is examined, it is seen more clearly how great a support position EMA200 is. If the pullbacks continue today, $1562, EMA55, and $1546 aEMA200 are our first support points to follow. In case the upward movement starts, the $1601 EMA5 and $1618 EMA21 levels are the first resistance levels I will follow.
This article does not contain investment advice or recommendations. Every investment and trading move involves risk, and readers should conduct their own research when making a decision.
You may be interested in:


